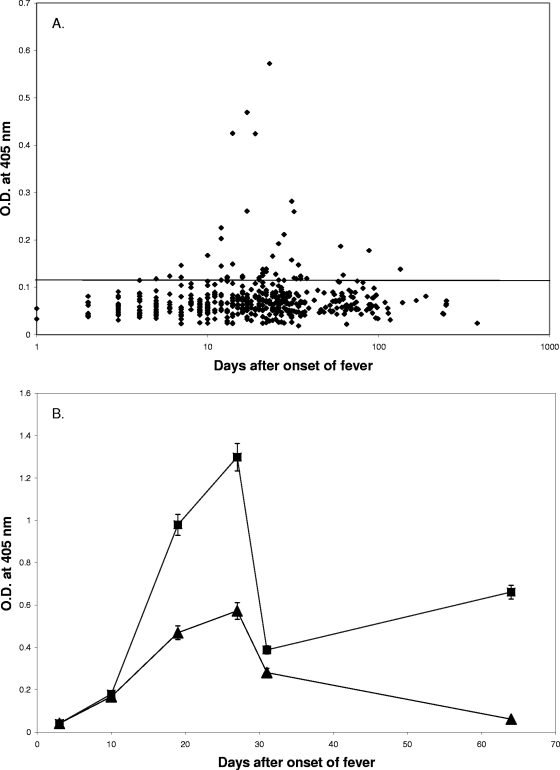
FIG. 2.
ELISA results for 480 scrub typhus patient sera with rhHtrA1. The cutoff values are 0.117 for rhHtrA1 and 0.158 for r47b (means for 82 negative controls plus 2 standard deviations). (A) Relationship of reactivity (as reflected by the optical density determined by ELISA) to the number of days after the onset of fever. The x axis indicates the number of days after the onset of illness, and the y axis indicates the optical density at 405 nm. (B) Time course of reactivity of patient MAK116 sera collected at days 3, 10, 19, 27, 31, and 64 with the recombinant 47-kDa (▪) and rhHtrA1 (▴) proteins. The symbols indicate the averages of two experiments, and the error bars represent ranges. O.D., optical density.

