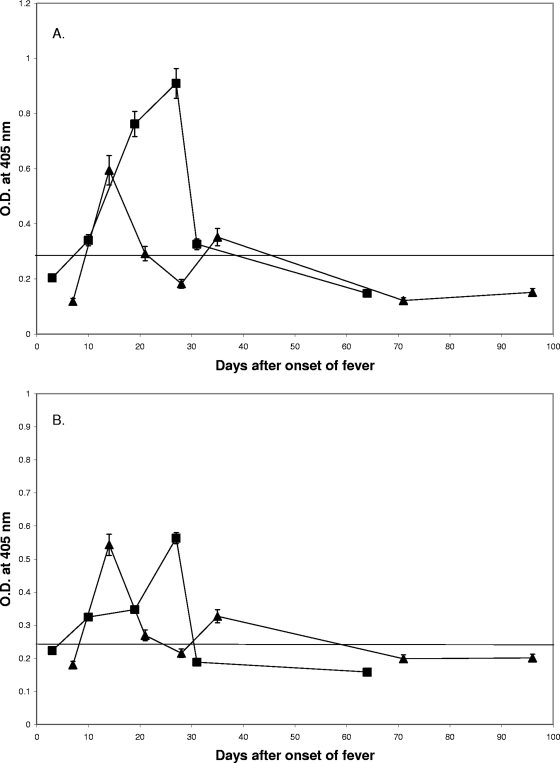
FIG. 5.
Time course of antibody responses of two patients to hHtrA1 synthetic peptides. P216-236 (A) and P285-308 (B) were tested with sera from serial bleeding of patient MAK116 (▪) collected at days 3, 10, 19, 27, 31, and 64 and patient MAK131 (▴) collected at days 7, 14, 21, 28, 35, 71, and 96. The cutoff values for positive results are 0.221 and 0.237 (means of 10 negative controls plus 2 standard deviations) for P216-236 and P285-308, respectively. The symbols indicate the averages of two experiments, and the error bars represent ranges. O.D., optical density.

