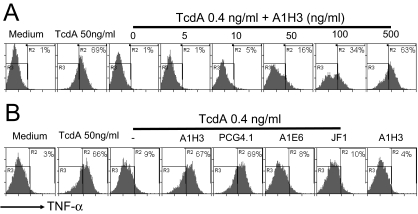
FIG. 4.
Effects of MAbs on TcdA-induced TNF-α production by macrophages. RAW 264.7 cells were treated with TcdA (50 ng/ml) or with TcdA (0.4 ng/ml) complexed with A1H3 at the indicated doses (A) or TcdA (0.4 ng/ml) complexed with 1 μg/ml MAb A1H3, A1E6, PCG4.1, or JF1 (B) for 6 h. The TNF-α production was determined by intracellular staining followed by FACS analysis as described in Materials and Methods. The R3 region shows data for TNF-α-negative cells, and the percentage of TNF-α-positive cells is indicated in the R2 region.

