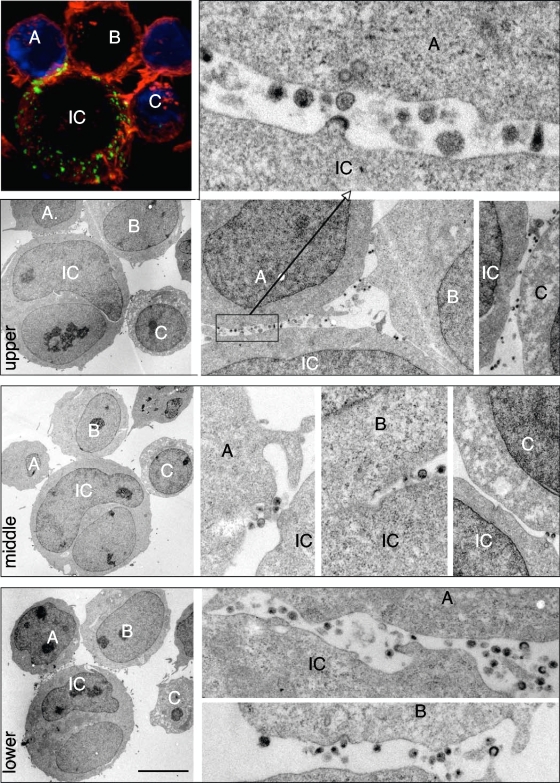
FIG. 5.
Analysis of polysynapses by correlative IF-TEM. HIV-1-infected Jurkat cells were mixed with Far Red dye-labeled Jurkat recipients (blue) for 1 h and stained for HIV-1 Gag (green) and F-actin (red). Samples were placed on a grid with a coordinate system to locate the regions of interest. In the upper left panel, a conjugate formed between one infected cell (IC) and three target cells (labeled A, B, and C) is visualized by confocal microscopy. Samples were then sectioned, and the same conjugate was analyzed by TEM. Three sections, at 0.5 to 1-μm intervals (z axis), are depicted on the three lower left panels. They correspond approximately to the upper, middle, and lower regions of the conjugate. Various magnifications of the intercellular contact zones are depicted in the right panels. The scale bar represents 5 μm.

