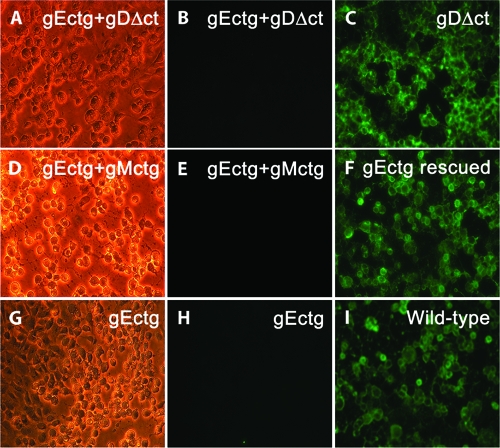
FIG. 5.
Immunofluorescence detection of gE expression. Vero cells were infected at an MOI of 1, and gE expression was detected by indirect immunofluorescence at 36 hpi. The panels in the left column are phase-contrast micrographs of infected cells. The panels in the center column are fluorescent micrographs of mutant viruses lacking gE with anti-gE monoclonal antibody. The panels in the right column are fluorescent micrographs of mutant and wild-type viruses that express gE. All mutant viruses containing the ATG-to-CTG mutations in gE (gEctg) failed to react with anti-gE antibody (panels B, E, and H), while viruses expressing the wild-type gE reacted with the anti-gE antibody (panels C, F, and I).

