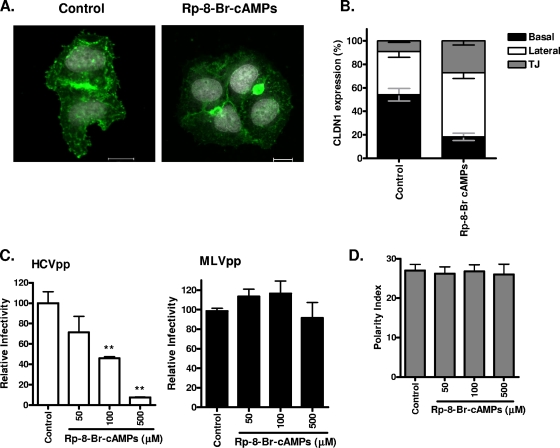
FIG. 6.
Inhibition of PKA modulates basolateral pools of CLDN1 and HCV entry. (A) HepG2 cells transduced to express AcGFP.CLDN1 and DsRED.CD81 were seeded onto glass coverslips, and after 4 h in serum-free DMEM, they were treated with DMSO (control; 1:1,000) or Rp-8-Br-cAMPs (500 mM) for 1 h. Cells were visualized using confocal microscopy, and the CLDN1 localization was assessed. Bars, 20 μm. (B) Reorganization of AcGFP.CLDN1 after a 1-h treatment with control or Rp-8-Br-cAMPs (500 mM). The percentages of CLDN1 at the basal (black), lateral (white), and TJ (gray) locations were measured. (C) HCVpp (white bars) and MLVpp (black bars) infection of HepG2-CD81 cells (3 days postplating), following treatment with the control (1:1,000) or Rp-8-Br-cAMPs (50, 100, or 500 mM) for 1 h. Relative infectivity was calculated as a percentage of control cells ± SD. **, P < 0.001 (t test). HCVpp infectivity values for HepG2-CD81 and HepG2 cells were 14,710 ± 1,683 RLU and 447 ± 14 RLU; MLVpp infectivity values for HepG2-CD81 and HepG2 cells were 193,003 ± 1,873 RLU and 115,300 ± 1,140 RLU. (D) HepG2-CD81 cells were allowed to polarize over 3 days and were treated with serum-free DMEM for 4 h, followed by exposure to control (1:1,000) or Rp-8-Br-cAMPs (50, 100, or 500 mM) for 1 h. Cells were fixed, and the polarity index was enumerated from five fields of view from three independent coverslips.

