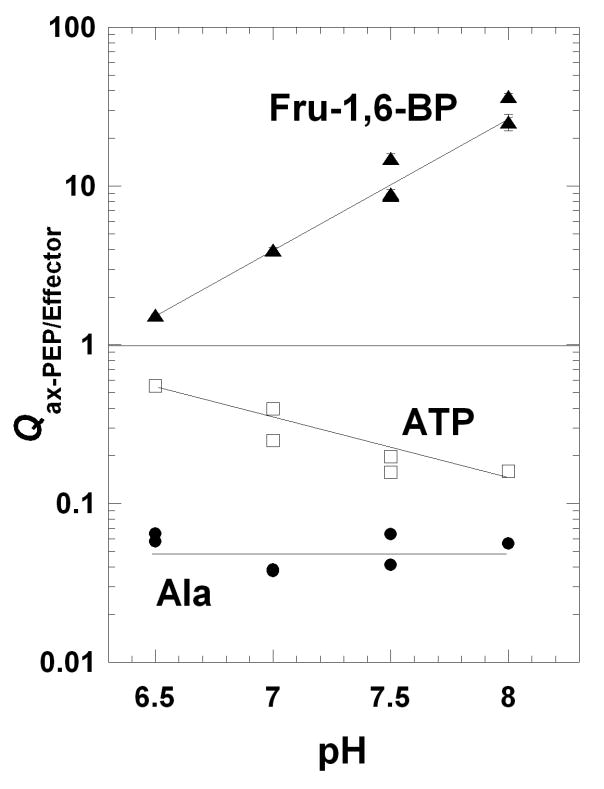
Figure 4.
Qax for the regulation by Fru-1,6-BP (▲), ATP (□), and Ala (●) as a function of pH. Qax values were obtained from fits of data as exemplified in Figure 3 to Equation 2. Lines represent data trends. When error bars are not apparent, they are smaller than the data point symbols.

