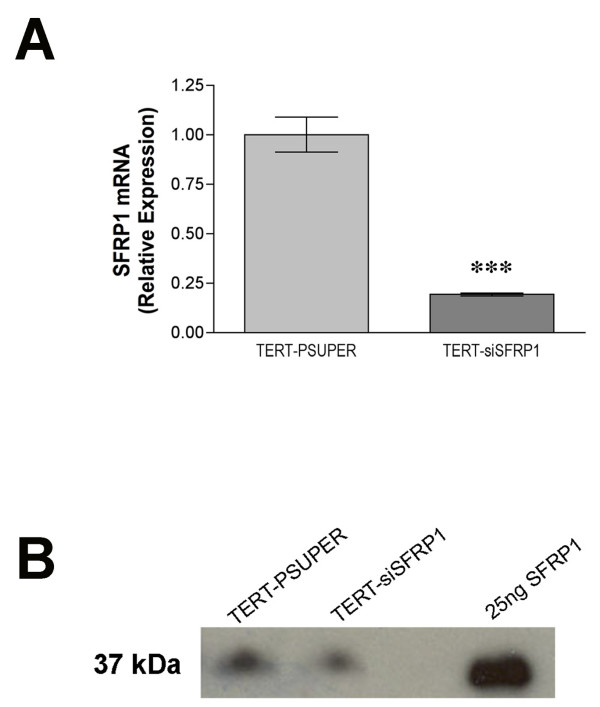
Figure 1.
The relative expression levels of SFRP1 mRNA and protein are reduced in TERT-siSFRP1 cells. A, Total RNA was isolated from each cell line for real-time PCR analysis. The level of SFRP1 mRNA was normalized to amplification of GAPDH mRNA, which was performed in parallel wells for each cell line. Bars represent mean ± SEM SFRP1/GAPDH and are expressed as relative expression of TERT-PSUPER cells. ***p < 0.001 (significantly different from TERT-pSUPER cell line using student's t-test). B, The proteins from TERT-pSUPER and TERT-siSFRP1 supernatants were collected, concentrated, and SFRP1 expression was assessed by Western Blot Analysis. Twenty-five ng of recombinant SFRP1 was loaded onto the gel to confirm SFRP1 band size and specificity.

