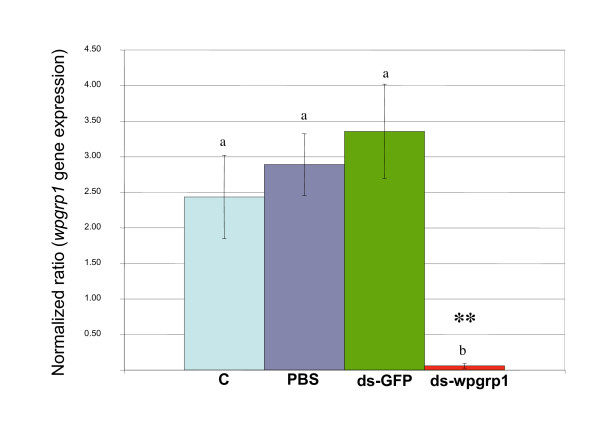
Figure 3.
Q-RT PCR analysis of wpgrp1 transcripts isolated from bacteriome tissues taken from fourth instar larvae four days after the treatments. C, are untreated control larvae; PBS, ds-gfp and ds-wpgrp1 are larvae injected with PBS, gfp-dsRNA and wpgrp1-dsRNA, respectively. Data are normalized with the gapdh transcript levels, expressed as means of 5 independent repetitions and analyzed with one-way ANOVA and Tukey HSD post hoc test. The asterisks show significant differences (p < 0.05).

