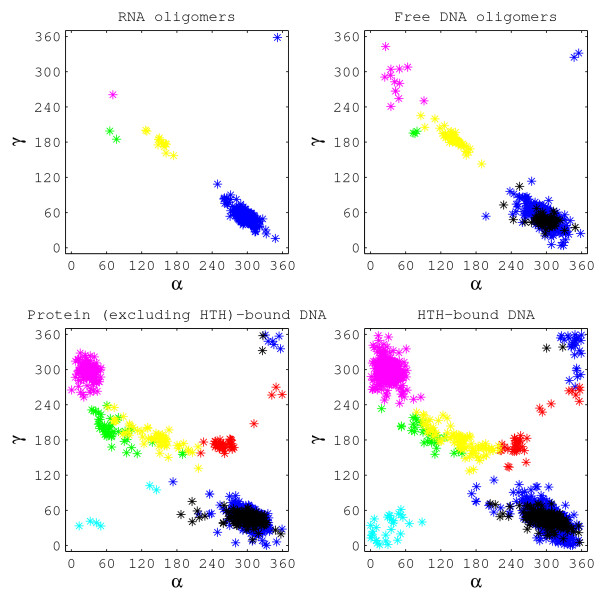
Figure 4.
The correlation between the backbone torsion angles γ vs α for all four datasets is shown in different colours, indicating the seven states as defined in [53]. The seven states are colour coded as follows: State 1 – Blue; State 2 – Red; State 3 – Green; State 4 – Cyan; State 5 – Yellow; State 6 – Magenta; State 7 – Black.

