Fig. 2.
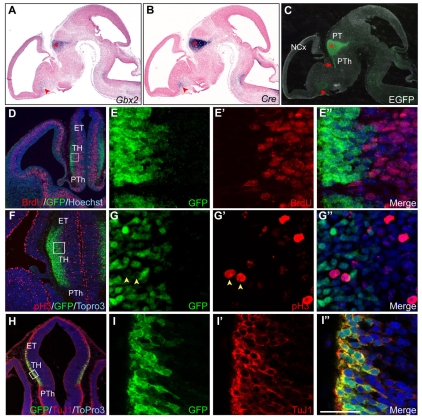
Expression of CreER and EGFP recapitulates the endogenous Gbx2 in Gbx2CreER/+ embryos. (A-C) Expression of Gbx2 (A) and CreER (B) transcripts, and EGFP proteins (C) on adjacent sagittal brain sections of Gbx2CreER/+ embryos at E12.5. The expression in the thalamus and the medial ganglionic eminence is marked by the asterisk and arrowhead, respectively. The arrow indicates thalamic axonal processes. (D-E″) Double-immunofluorescence analysis of BrdU and GFP on coronal brain sections of Gbx2CreER/+ embryos at E12.5. The boxed area in D is magnified in E-E″. (F-G″) Confocal images of immunofluorescence of pH3 and GFP on coronal brain sections of Gbx2CreER/+ embryos at E12.5. The boxed area in F is magnified in G-G″. Note that most of the pH3-positive cells are negative for GFP, whereas two pH3-positive cells that display weak GFP immunoreactivity are marked by the yellow arrowheads. (H-I″) Confocal images of immunofluorescence of GFP and TuJ1 on coronal brain sections of Gbx2CreER/+ embryos at E11.5. The boxed area in H is magnified in I-I″. ET, epithalamus; mb, midbrain; Ncx, neocortex; PT, pretectum; PTh, prethalamus; TH, thalamus. Scale bars: 1034 μm in A-C; 400 μm in D; 300 μm in F; 600 μm in H; 50 μm in E-E″,G-G″,I-I″.

