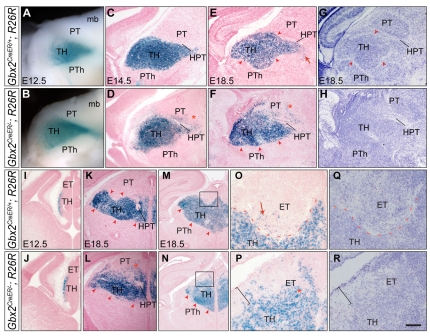
Fig. 4.
Loss of Gbx2 disrupts the dorsal and posterior borders of the thalamus. (A-F) After tamoxifen administration at E10.5, X-gal staining of whole-mount (A,B) and sagittal brain sections of Gbx2CreER/+ and Gbx2CreER/- embryos (C-F) at different stages, as indicated. (G,H) Nissl analysis of immediate adjacent sections of E and F, respectively. (I-P) After tamoxifen administration at E10.25 (I-L) or E10.5 (M-P), X-gal analysis of coronal brain sections of Gbx2CreER/+ and Gbx2CreER/- embryos at E12.5 (I,J) and E18.5 (K-P). The boxed area in M and N is magnified in O and P. (Q,R) Nissl analysis of adjacent sections of O and P, respectively. The arrowheads indicate the lineage-restriction boundaries; the asterisks indicate cells that violate compartment boundaries; the red dashed line indicates the border between the thalamus and lateral habenular nucleus; the arrow indicates marked cells in the nucleus of Darkschewitsch (E) and the lateral habenlar nucleus (O). Note that the HPT is enlarged in Gbx2 mutants (H and L), and that the region under the pial surface contains sparse cells in the mutants (bracket in P and R), probably due to abnormal accumulation of neuritis. ET, epithalamus; HPT, habenular-peduncular tract; mb, midbrain; Ncx, neocortex; PT, pretectum; PTh, prethalamus; TH, thalamus. Scale bars: 265 μm in C,D; 250 μm in E-H; 350 μm in I,J; 450 μm in K-N; 200 μm in O-R.

