Fig. 7.
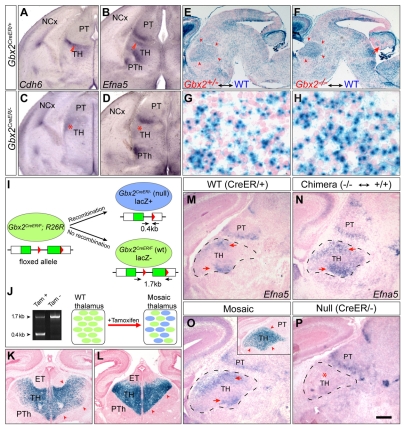
Gbx2 plays a cell-nonautonomous role in controlling the thalamic lineage boundaries. (A-D) In situ hybridization analysis of Cdh6 and Efna5 expression on the coronal brain sections of Gbx2CreER/+ and Gbx2CreER/- embryos at E14.5. The arrowhead indicates the expression in the thalamus; the asterisk marks the diminished Cdh6 and lost Efna5 expression in the mutant embryos. (E-H) X-gal and Fast Red staining of sagittal brain sections of E16.5 chimeric embryos composed of wild-type (blue) and ES-derived cells (pink) of genotype Gbx2+/- (E) or Gbx2-/- (F). The arrow indicates aggregates of Gbx2-/- cells in the cerebellum; the arrowheads indicate the sharp thalamic borders. (G,H) Magnified view of the thalamus in E and F. Note that the Gbx2-/- cells, like Gbx2+/-, extensively intermingle with the host cells in the thalamus. (I) Schematic diagram illustrating the generation of genetic mosaics using CreER-mediated deletion of Gbx2 in the thalamus of Gbx2CreER/F; R26R embryos. The arrows indicate the primers for PCR analysis to detect the floxed (1.7 kb) and deletion (0.4 kb) alleles of Gbx2. (J) PCR analysis of microdissected thalamus of Gbx2CreER/F; R26R embryos. Note that the thalamus contains both Gbx2CreER/F and Gbx2CreER/- cells after tamoxifen administration, but only Gbx2CreER/F cells without tamoxifen. (K,L) X-gal staining of coronal brain sections of two Gbx2CreER/F; R26R embryos with different levels of β-gal activity at E18.5 after tamoxifen administration at E10.5. The arrowheads mark the sharp borders of the fate-mapped Gbx2 lineage. (M-P) In situ hybridization of Efna5 on sagittal brain sections of Gbx2CreER/+ (M), Gbx2-/-wild-type chimera (N), Gbx2CreER/FGbx2CreER/- mosaic (O), and Gbx2CreER/- (P) embryos at E16.5. Inset in O shows X-gal staining of a sagittal section of the mosaic embryo. The arrows indicate the restored expression of Efna5 in the chimeric and mosaic embryos; the asterisk indicates the absence of Efna1 expression in the thalamus of Gbx2-/- embryo. ET, epithalamus; Ncx, neocortex; PT, pretectum; PTh, prethalamus; TH, thalamus; WT, wild type. Scale bars: 400 μm in A-D; 450 μm in E,F; 29 μm in G,H; 380 μm in K; 200 μm in L-O.

