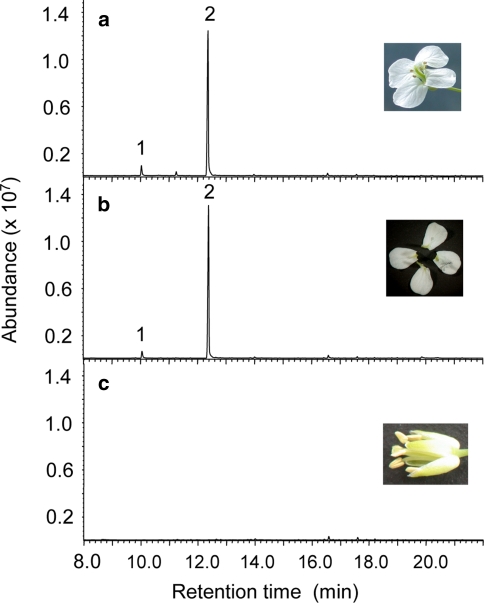
Fig. 2.
Organ-specific emission of floral volatiles. GC–MS chromatograms of volatiles emitted from a single intact flower (a), the detached petals of a single flower (b), and a single flower from which petals were removed (c). Volatiles were trapped in 1-ml glass vials by solid-phase microextraction (SPME) as described under “Materials and methods”. Flowers were from a Plech plant with an “4A2”-type volatile profile (see Fig. 1a, c)

