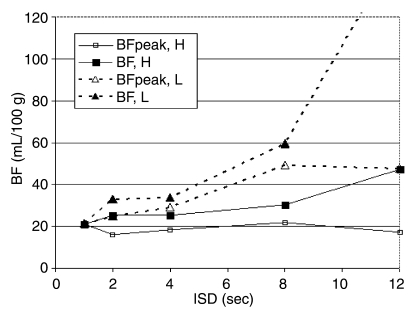
Figure 4b:
(a) Graph shows changes in BF measurements at various ISDs with (BFpeak) or without (BF) inclusion of the image at peak vascular enhancement. At a TST of 2 minutes, inclusion of the peak enhancement image eliminates variability of results, even for data sets obtained with an ISD of more than 8 seconds. Mean BF values and corresponding standard deviations (vertical bars) obtained with the peak enhancement image included were shown to be close to those obtained with the reference sequence, even for longer ISDs. (b) Graph shows changes in BF measurements at various ISDs with or without inclusion of the peak vascular enhancement image and use of different doses of intravenous contrast material. Inclusion of the peak vascular enhancement image contributes to reduced variability of results. However, BF values obtained after intravenous administration of a low dose of the iodinated contrast agent with the peak vascular enhancement image included (BFpeak, L) or excluded (BF, L) are globally higher than those obtained after intravenous administration of a high dose of the iodinated contrast agent with the peak vascular enhancement image included (BFpeak, H) or excluded (BF, H).

