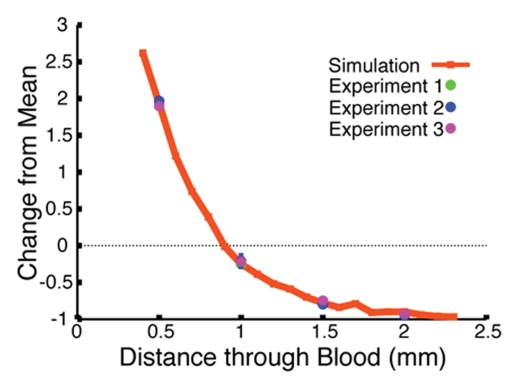
Figure 2b:
Monte Carlo simulation results. (a) Schematic illustration of the simulation design shows 1.6-mm fiberoptic catheter modeled to be suspended in volume of blood, below which is a pool of free fluorescent dye. (b) Graph shows results of validation of Monte Carlo simulation at in vitro experimentation with Cy5.5 dye. The simulation-derived prediction (red line) correlates well with results obtained in three independent in vitro experiments (green, blue, and purple circles), in which fluorescence from a well of Cy5.5 dye was measured through 0.5, 1.0, 1.5, and 2.0 mm of blood. (c) Graph shows results of validation of Monte Carlo simulation at in vitro experimentation with AF750 dye. Similar to results in b, the simulation-derived prediction of the attenuation of AF750 dye fluorescence (red line) correlates well with values derived in three independent experiments (green, blue, and purple circles), in which fluorescence from a well of AF750 dye was measured through 0.5, 1.0, 1.5, and 2.0 mm of blood. (d) Graph shows results of evaluation of ratiometric correction method involving use of different fluorochrome pairs. The simulation was used to evaluate different ratios of dyes and determine the fluorochrome pair with the ratio that exhibited the least signal variation through a volume of blood. Simulation results for two such ratios, Cy5.5-AF750 fluorescence ratio and AF633-AF750 fluorescence ratio, are shown. Compared with Cy5.5-AF750 ratio, AF633-AF750 ratio yielded less signal variation across 1 mm of blood. Simulated variance in raw AF750 signal (green line) is ±60%, whereas variance in corrected AF633-AF750 ratio signal is ±3% over this distance.

