Figure 3c:
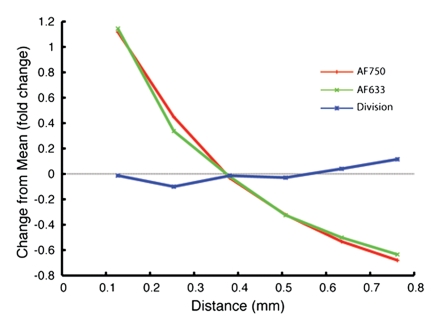
In vitro demonstrations of attenuation correction with dual fluorescence normalization technique. (a) Graph data indicate that AF633 fluorescence was substantially attenuated by blood such that the curves representing various dye concentrations quickly converged on one another. (b) Curves for various concentrations of AF633 dye became discrete after AF633 signal was normalized with simultaneously occurring fluorescence measured from constant concentration of AF750 dye. Lines represent mean ratios for the three AF633 concentrations across a given distance in blood. Solid bars represent standard errors. Thus corrected fluorescence intensity enables one to determine the dye concentration, regardless of the distance the photons travel in blood. (c) Graph data indicate that percentage change in mean signal intensity of AF633 fluorescence across a volume of blood is dramatically reduced by means of correction with AF750 fluorescence intensity at the same distance.

