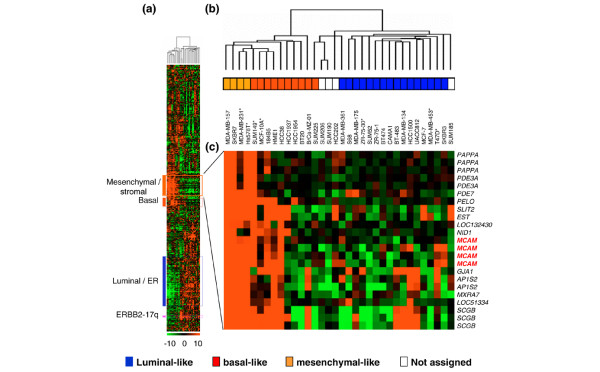
Figure 4.
CD146 mRNA expression in human breast cancer cell lines. (a) Hierarchical clustering of 34 mammary cell lines and 13,976 genes/Expressed Sequence Tags based on mRNA expression levels. The legend is similar to Figure 2. Colored bars to the left, locations of four gene clusters of interest. The stromal/mesenchymal gene cluster (orange bar) includes MCAM. ER, estrogen receptor. (b) Dendrogram of cell lines. *Cell lines analyzed in the present study by flow cytometry for CD146 expression (low expression, MCF-7, ZR-75-30 and MDA-MB-453; high expression, MDA-MB-231, Hs578T and MCF-10A). (c) Expanded view of the stromal/mesenchymal gene cluster, which includes the four probe sets representing CD146/MCAM. Genes are referenced by their HUGO abbreviation as used in Entrez Gene.

