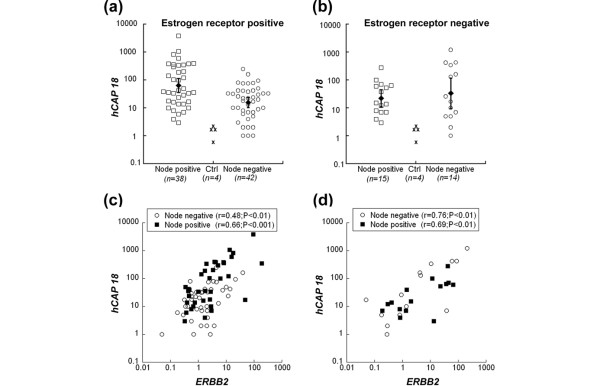
Figure 1.
hCAP18 transcript levels in relation to ERBB2 levels, lymph node status and oestrogen receptor (ER) status. All transcription levels determined by real-time reverse transcriptase PCR are displayed relative to the mean of four control samples. (a) Significantly higher levels of hCAP18 transcript for lymph node positive compared with lymph node-negative ER-positive patients (p < 0.001). (b) No significant difference in hCAP18 levels with respect to lymph node status was observed for ER-negative patients (a, b) filled markers and error bars represent geometric means and 95% confidence intervals. The association between hCAP18 levels and lymph node status was significantly different for (a) ER-positive and (b) ER-negative patients (p = 0.01). (c, d) Significant correlation between levels of hCAP18 and ERBB2 was observed in all groups, whether (c) ER positive or (d) ER negative, and irrespective of lymph node status (squares versus circles).

