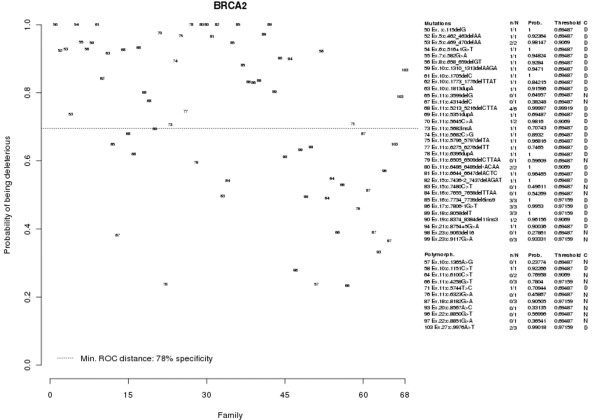
Figure 2.
Predicted probabilities of the BRCA2 control populations. Plot showing the predicted probabilities of the control populations in BRCA2 using the logistic regression model obtained for BRCA2. Dotted cutoff lines, probability from the BRCA2 model that minimizes the receiver operating characteristic (ROC) distance. The parameters evaluated for the BRCA1 variants (explained in Figure 1) are also shown for each of the BRCA2 genetic variants. Sequence nomenclature: NCBI reference sequence U43746.1 (BRCA2), numbering starting at the A of the ATG translation initiation codon.

