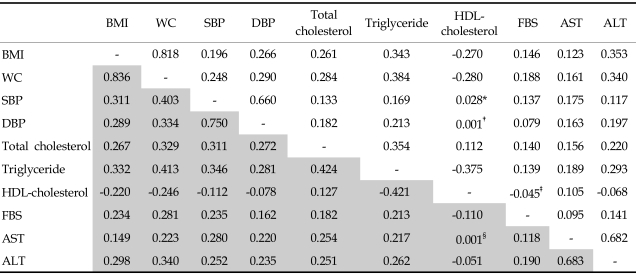
Table 2.
Correlation Among Metabolic Risk Factors and Serum Aminotransferase Levels
Figures are Spearman correlation coefficients for men in the upper right of the table, for women in the lower left of the table.
BMI, body mass index; WC, waist circumference; SBP, systolic blood pressure; DBP, diastolic blood pressure; HDL, high density lipoprotein; FBS, fasting blood sugar; AST, aspartate aminotransferase; ALT, alanine aminotransferase.
All correlations were significant with p < 0.001, except for *p = 0.077; †p = 0.954; ‡p = 0.004; §p = 0.928.

