Figure 2.
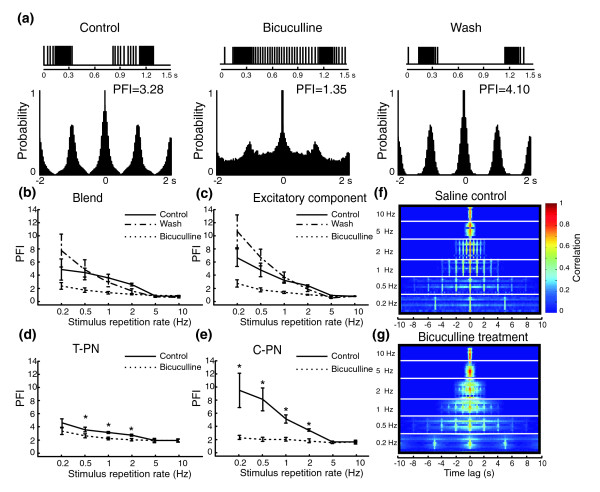
Bicuculline-effects on PNs' pulse-tracking capability. (a) Autocorrelation-based pulse-following index (PFI) was calculated to quantify the capability of PNs to track odor pulses delivered at 1 Hz repetition rate under saline control (left), bicuculline treatment (center), and saline wash (right). The raster plots above the correlograms illustrate the response of a T-PN to two consecutive odor pulses. Note that the drop in PFI value during bicuculline treatment is consistent with the decreased pulse resolution shown in the raster plots. (b-e) Population data (mean ± SEM) showing that bicuculline treatment consistently decreases the PFI values. (b, c) This effect was independent of stimulus type: (b) blend; (c) individual excitatory stimulus component. However, the PFI profiles for (d) T-PNs and (e) C-PNs were dramatically different, with C-PNs having higher PFI values in the range 0.2–1 Hz than the T-PNs under saline control (solid line), thus resulting in a greater drop in PFI values from control to bicuculline treatment (dotted line). Asterisks indicate statistical significance between control and drug treatment (repeated-measure two-way ANOVA at p = 0.05 level). (f-g) Stacked correlograms derived from the responses of ten PNs to their specific ligands show their capability to track odor pulses delivered at various repetition rates (ranging from 0.2 to 10 Hz) under (f) saline control and (g) bicuculline treatment. The pseudocolor scale, indicating the correlation coefficient, applies to both panels.

