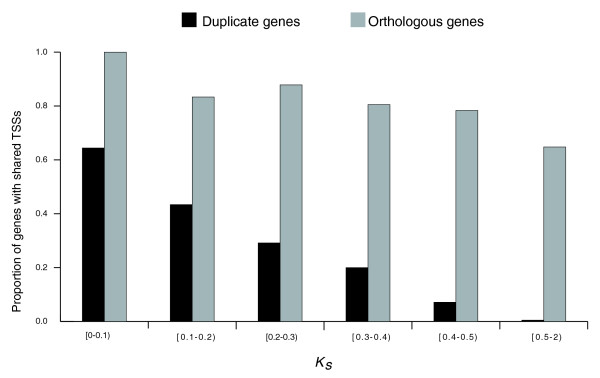
Figure 1.
The decline in the proportion of group A duplicate gene pairs with shared TSSs (shown in black) depending on the time since duplication (approximated by KS). The proportion of human-mouse orthologous genes with conserved TSSs is shown for comparison (in gray); in this case variation in KS is due to regional variation in substitution rates.

