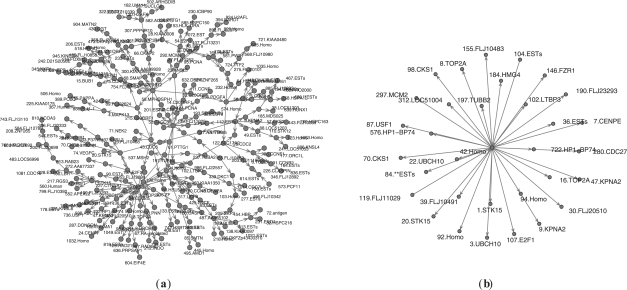
Fig. 3.
Subnetworks corresponding to (a) the largest component, (b) the gene with the largest degree using the Experiment 3 dataset and Lmax=4. [The number at the beginning of each gene name indicates the row number in data from Whitfield et al. (2002), which contain the full gene names.]

