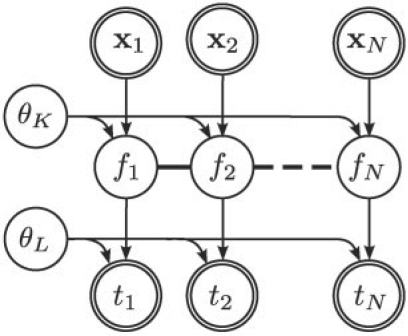
Fig. 2.
Bayesian network representation of a GP regression model. The model relates observed independent input/output pairs {xn, tn}n=1N. The thick lines couple the latent function value {fn}, illustrating the smoothness assumptions introduced by the GP prior. The parameters θK and θL denote hyperparameters of the kernel and likelihood, respectively.

