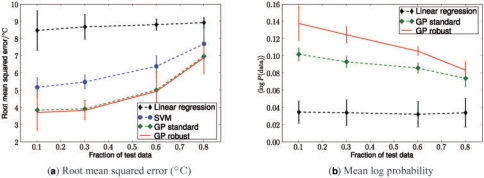
Fig. 4.
Comparative predictive performance of different algorithms evaluated as a function of the relative test-set size (260 total measurements). (a) Root mean squared error on the test set. (b) Mean log probability of the test data under the predictive distribution. Error bars show 1SD estimated from 100 random training/test splits.

