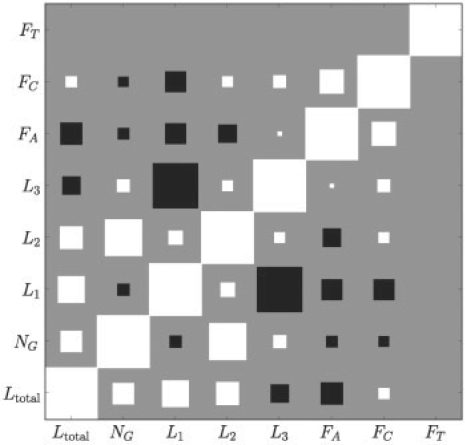
Fig. 6.
Correlations between inferred hyperparameters illustrated as Hinton diagram. Correlation coefficients were estimated from 500 Monte Carlo sample. The size of the squares denote the strength of the correlation, where white squares indicate positive correlation and black squares negative correlation.

