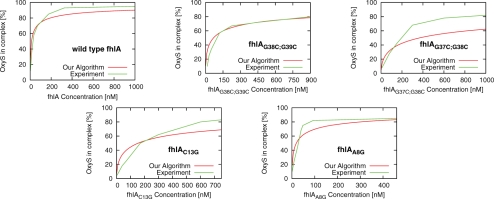
Fig. 11.
Experimental and computational determination of equilibrium constants for pairs of OxyS with wild-type and mutated fhlA. Horizontal axis denotes the initial concentration of fhlA, and the vertical axis denotes the percentage of OxyS in OxyS–fhlA complex. Initial concentration of OxyS was 2 × 10⁻⁹ M (Argaman and Altuvia, 2000). Both RNAcofold and UNAFold predict that the percentage of OxyS in complex is approximately 0 for the considered fhlA concentrations.

