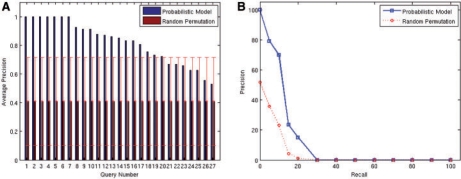
Fig. 3.
(A) Average Precision for cancer queries for the top 10 results. Queries are sorted by the average precision given by the topic model. Error bars represent the 99% confidence interval of the random permutation results. (B) Interpolated average precision at 11 standard recall levels (given as percentages). The solid line corresponds to our method; the dashed line corresponds to the baseline.

