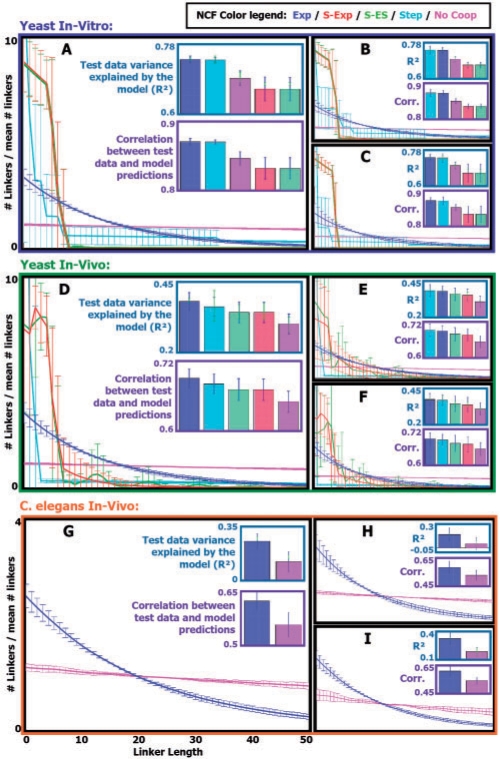
Fig. 5.
(A) Parameters of five NCF types (together with the model's temperature and nucleosome concentration parameters) were learned from yeast in vitro data of nucleosome mapping over a 1M-bp-long sub-sequence of chromosome 4, in a 5-fold cross validation manner. Results for each NCF type are color coded according to a color legend that appears at the center of the figure. For each learned NCF shown are: in the top bar plot, the cross validation mean (bar) and SD (blue error bar) of the test R2 statistic (quantifying the fraction of the variance in the test data that is explained by the model with the learned NCF), as well as the cross validation mean and SD of the train R2 statistic (light green error bar). In the bottom bar plot, shown is the cross validation mean (bar) and SD (blue error bar) of the correlation between the test data and the model predicted average occupancy. In the graphs plot, shown is the cross validation mean and SD (per linker length) of the linker lengths distribution (over linker lengths 0–50) sampled using the model with the learned NCF. (B) Same as in (A), for chromosome 7. (C) Same as in (A), for chromosome 12. (D–F) Same as in (A–C), respectively, for yeast in vivo data. (G) Same as A, for in vivo data of C.elegans chromosome I. (H) Same as (G), for chromosome II. (I) Same as (G), for chromosome III.

