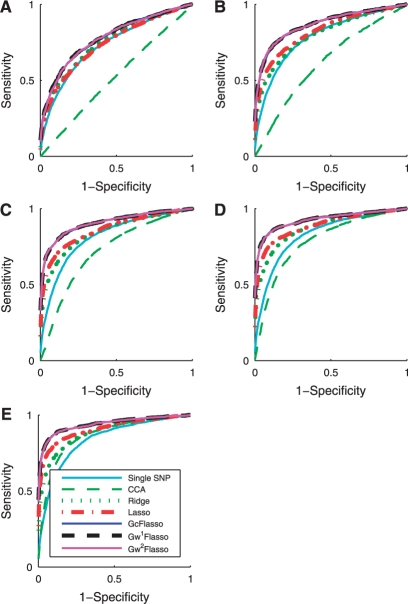
Fig. 3.
ROC curves for comparison of association analysis methods with different sample size N. (A) N = 50; (B) N = 100; (C) N = 150; (D) N = 200; and (E) N = 250. The effect size is 0.5, and the threshold ρ for the phenotype network is set to 0.3. Note that the curves for GcFlasso, G1wFlasso and G2wFlasso almost entirely overlap.

