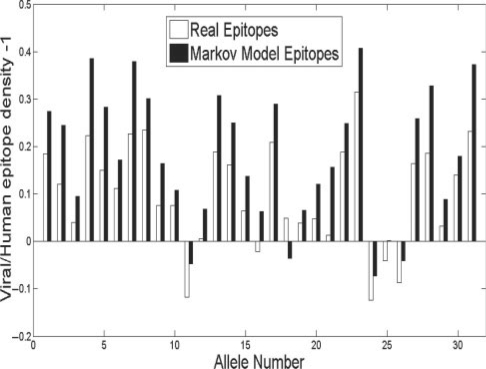
Fig. 2.
Comparison of epitope density in human and viral proteins. The white bars represent the ratio between the relative change between the viral and human epitope densities (i.e. viral epitope desnity/human epitope density –1). All positive values represent a higher viral epitope density. The black bars represent the same comparison performed on a random sequence based on human and viral amino-acid distributions.

