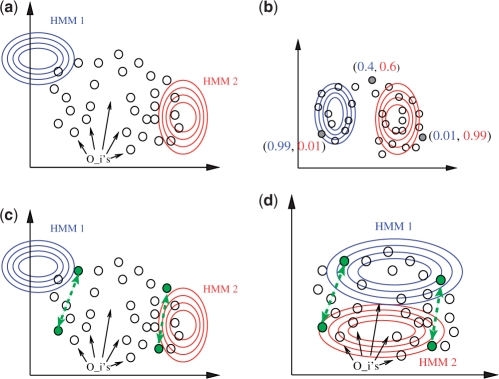
Fig. 2.
Schematic illustration of a mixture estimation with and without constraints. (a) The algorithm starts with an initial guess of the mixture components. (b) After termination, the mixture optimally explains the data points. Instead of a hard assignment to the components, each data point has a posterior distribution over the components. (c and d) By including constraints (dashed arrows in green), the EM algorithm strives for an optimum that discriminates the negatively constrained data points.

