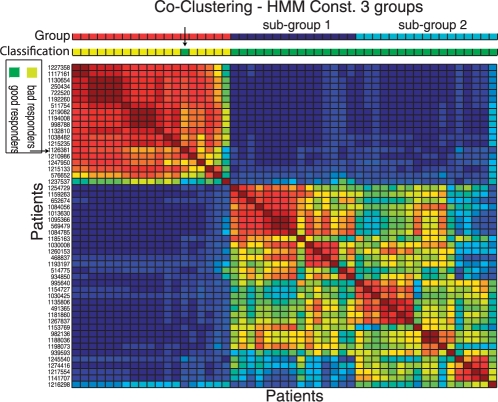
Fig. 5.
Matrix depicting the co-clustering of patients for HMMConst with three groups. A particular position in the matrix represents proportion of times the pair of patients was in the same group; red values indicating higher values. Red squares indicate stable groups of patients that tend to be grouped in several solutions. The bars above the matrix indicate the groups found by HMMConst (red for bad responders, dark blue for good responders 1 and light blue for good responders 2); and the classification of patient response based on clinical criteria only. The arrow indicates the putative mislabeled patient.

