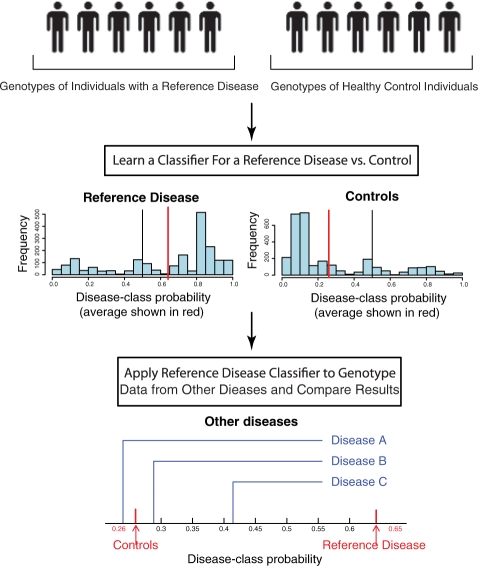
Fig. 1.
Overview of the approach. This figure presents the classification and comparison steps of our analysis pipeline. These steps are repeated using a different reference disease each time. The classifier returns a real value between 0.0 and 1.0 which we call disease-class probability. The histograms represent the distribution of the disease-class probability of the individuals with the reference disease (left) and of the controls (right). In the situation depicted in this figure, there is evidence that query disease C is more similar to the reference disease than the other query diseases.

