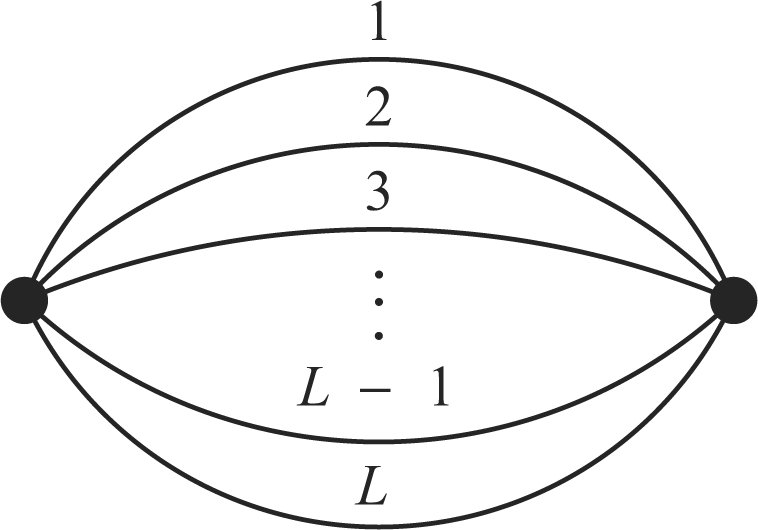
Fig. 1.

The match graph corresponding to the probability that two randomly chosen individuals have matching alleles at L loci. This probability is denoted by PWFL and PML in the WF and Moran models, respectively.

The match graph corresponding to the probability that two randomly chosen individuals have matching alleles at L loci. This probability is denoted by PWFL and PML in the WF and Moran models, respectively.