
Fig. 5.
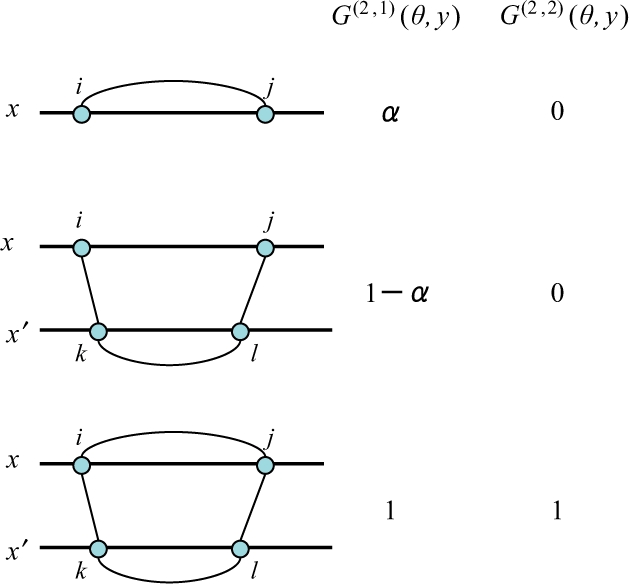
The difference between two gain functions G(2,1)(θ, y) and G(2,2)(θ, y). Each row indicates a configuration of θ on the target sequence x and each homologous sequence x′, and its positive contributions to the gain functions for yij = 1. For example, the middle row means that the configuration of θijx = 0 and θikxx′ = θklx′ = θjlxx′ = 1 have a positive (1 − α) contribution for yij = 1 in the gain function G(2,1), while have no contribution in the gain function G(2,2).