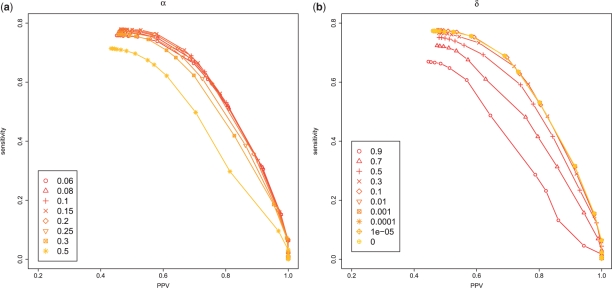
Fig. 6.
Performance of the different parameters for appro3-1. (a) We tested various values of α for δ = 0. (b) We tested various values of δ for α = 1/(|D| + 1) = 0.1. In both figures, we used p(a) in the ProbCons model and p(s) in the CONTRAfold model. The performance of the other combinations of probability distributions is shown in the Supplementary Material (Figs S1–S3).

