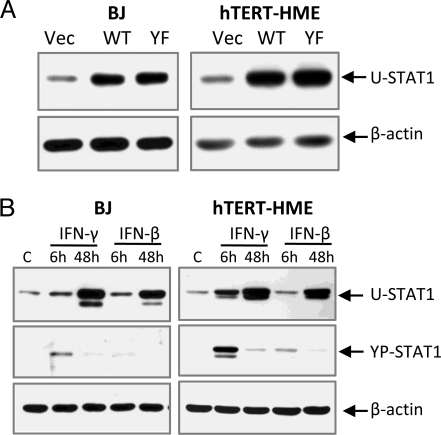
Fig. 2.
The expression of U-STAT1 and YP-STAT1 in cells used in microarray analyses. (A) hTERT-HME1 or BJ cells were infected with lentiviruses expressing wild-type (WT) or Y701F-STAT1 (YF), or with empty vector (Vec). The U-STAT1 protein expression levels were measured by the Western blotting method. (B) Cells were treated with IFN-β or IFN-γ for 6 or 48 h to establish a condition in which the maximum levels of U-STAT1 were induced at 48 h, with the minimum levels of YP-STAT1. The selected concentrations of IFNs (0.3 ng/mL IFN-γ or 3 units/mL IFN-β for BJ cells, and 0.1 ng/mL IFN-γ or 5 units/mL IFN-β for hTERT-HME1 cells) were applied, and the amounts of U-STAT1 and PY-STAT1 were analyzed by the Western blotting method.

