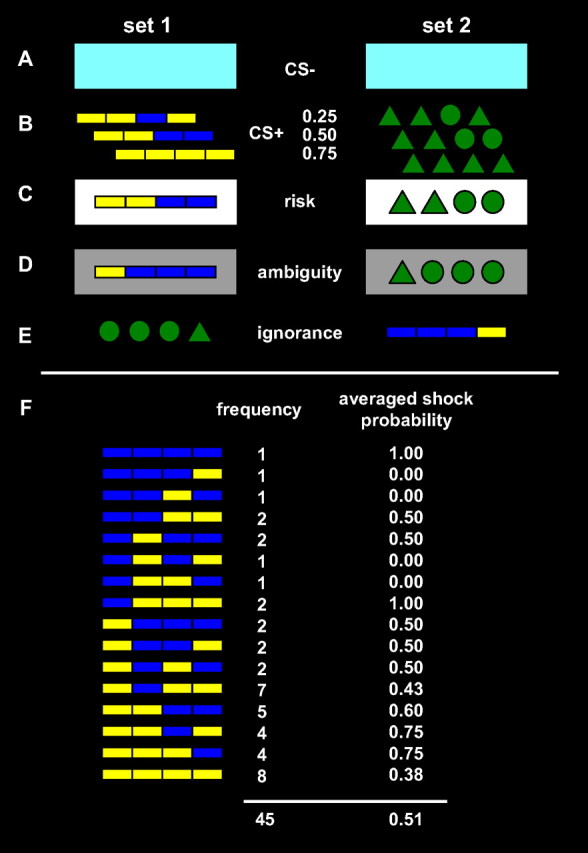
Figure 2.

Stimulus set 1 (left) and 2 (right) each of which were used on half of the participants to exclude condition effects due to simple graphical differences. A, CS− that was unchanged throughout the experiment, both in the preceding learning task and at test. B, Three CS+ that were used in the preceding learning task with different CS–UCS contingencies of 0.25, 0.50, and 0.75 as indicated. C, Risk condition used the three original CS+ cues and was signaled by a white frame around the original CS+. D, Example for an ambiguous stimulus, derived from stimulus C by flipping one of its information bits. The ambiguity condition was signaled by a gray frame around the degraded CS+. E, Example for a novel stimulus, corresponding to stimulus D by exchanging colors and geometric symbols, and reversing its information bits from left to right. F, All 16 possible ambiguous cues from set 1 (similarly for set 2 with geometric symbols instead of color bars). Each cue was surrounded by a gray frame (omitted in the figure). For each cue, its frequency during the whole experiment is indicated as well as the probability of electric shock after this cue, averaged over the whole experiment. Both frequency and shock probability were determined by the chance that this cue was derived from any of the three underlying risky cues, given a noise rate of 0.2 per information bit.
