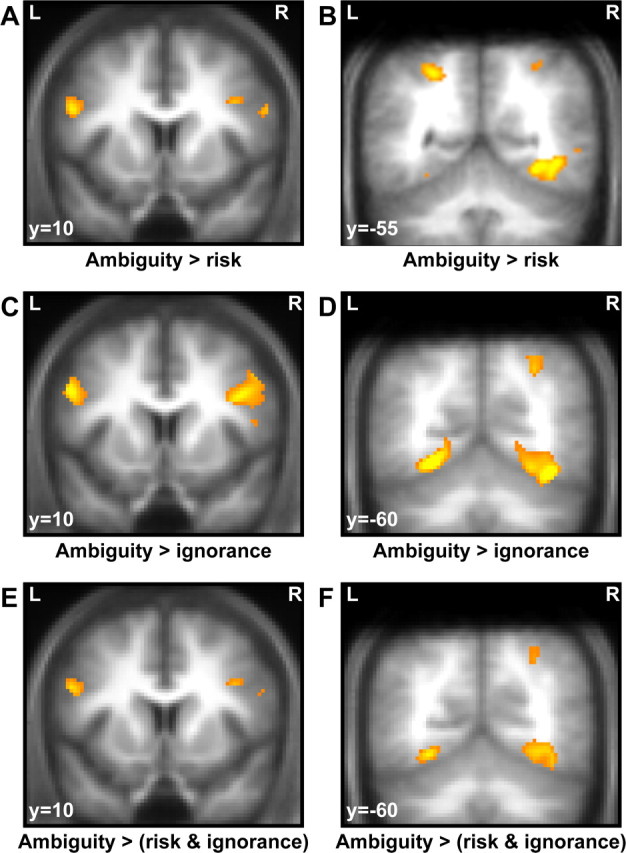
Figure 4.

BOLD responses to ambiguous cues, compared with risky or ignorance cues. Clusters are overlaid on a mean T1-weighted image from all participants, and displayed at a voxel-level threshold of p < 0.001 (uncorrected) and small-volume correction with regard to peak coordinates of previous studies as indicated in the methods section. A, Bilateral pIFG responses to ambiguous compared with risky cues. B, Bilateral pPAR and occipital responses to ambiguous compared with risky cues. C, Bilateral pIFG responses to ambiguous compared with ignorance cues. D, Right pPAR and bilateral occipital responses to ambiguous compared with ignorance cues. E, Bilateral pIFG responses to ambiguous compared with both risky and ignorance cues (conjunction analysis, testing against conjunction null). F, Right pPAR and bilateral occipital responses to ambiguous compared with both risky and ignorance cues (conjunction analysis, testing against conjunction null).
