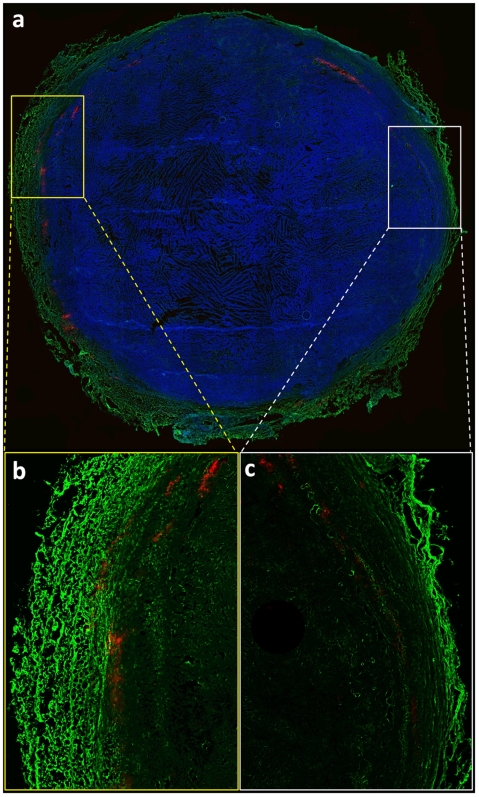
Figure 3. Histological evaluation of the intratumoral microdistribution of the probe and VEGFR-2.
(a) The nanoprobes (shown in red) localized in the periphery of the tumor showing a patchy distribution (DAPI was used as a nuclear stain; shown in blue; 4× magnification). In the same slide, the highly vascularized peripheral rim is shown to have high levels of VEGFR-2 (shown in green) compared to the less vascularized inner core. (b) High intratumoral deposition of the nanoprobe is found in a region with high levels of VEGFR-2. (c) Relatively few nanoprobes accumulated in a region of low VEGFR-2 levels.

