
Figure 6.
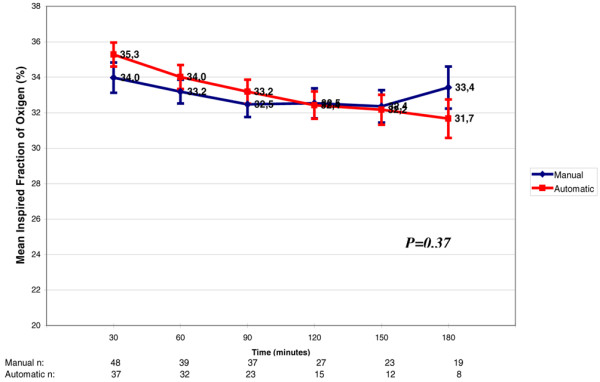
Variation in fraction of inspired oxygen (FiO2) throughout weaning. Each FiO2 value refers to increments of 30 minutes in the weaning process. There was no significant difference between the automatic mode and the manual mode (p = 0.37). The numbers at the bottom of the figure refer to the number of patients that stayed in the weaning trials through time. Decrement of FiO2 in both groups along time (p = 0.028)