
Figure 7.
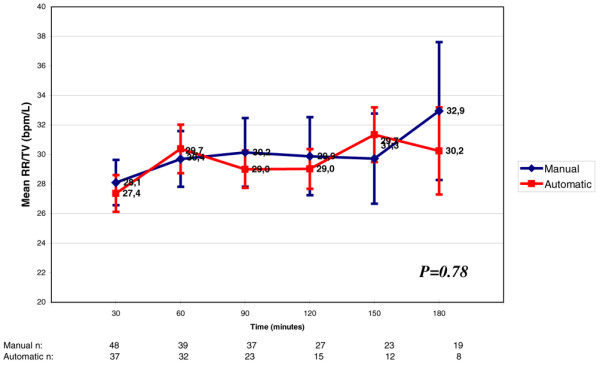
Variation of respiratory rate (RR)/tidal volume (TV) throughout weaning. Each RR/TV refers to increments of 30 minutes in the weaning process. There was no significant difference between the automatic mode and the manual mode (p = 0.78). The numbers at the bottom of the figure refer to the number of patients that stayed in the weaning trials through time.