Figure 3.

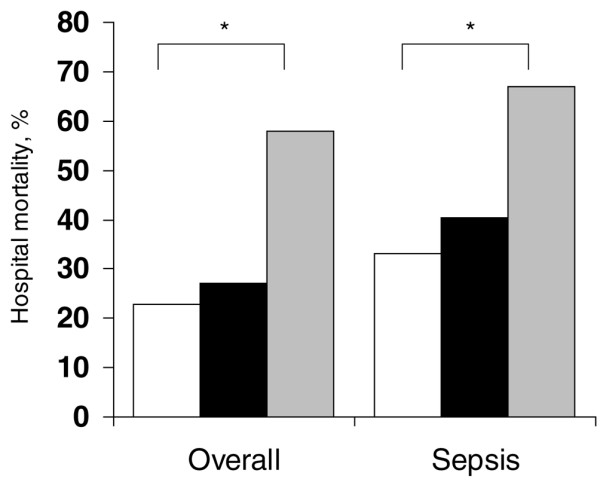
Hospital mortality in the three groups of patients overall and in patients with sepsis. White bars = no cancer; gray bars = haematological cancer; black bars = solid tumours. *p < 0.001 versus no-cancer group.

Hospital mortality in the three groups of patients overall and in patients with sepsis. White bars = no cancer; gray bars = haematological cancer; black bars = solid tumours. *p < 0.001 versus no-cancer group.