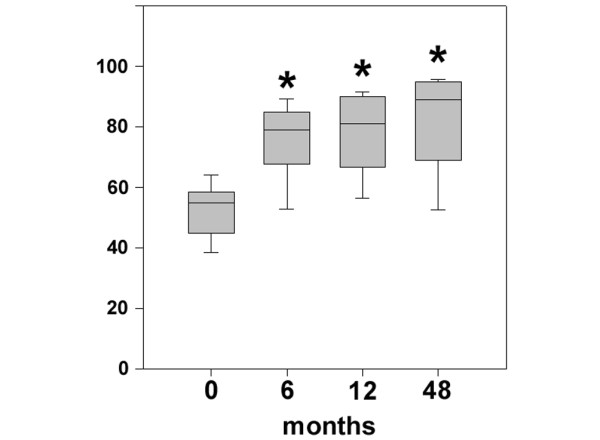
Figure 3.

Clinical outcome after four years as evaluated by the Lysholm score. Statistical analysis of the clinical outcome as assessed by the Lysholm score was performed using analysis of variance on ranks (P < 0.00001) and subsequently the all-pairwise comparison according to Dunn's method. Scores are presented as the median, with the ends of the boxes defining the 25th and 75th percentiles and error bars defining the 10th and 90th percentiles. Where indicated (asterisks), differences were statistically significant (P < 0.05) compared with the preoperative situation.
