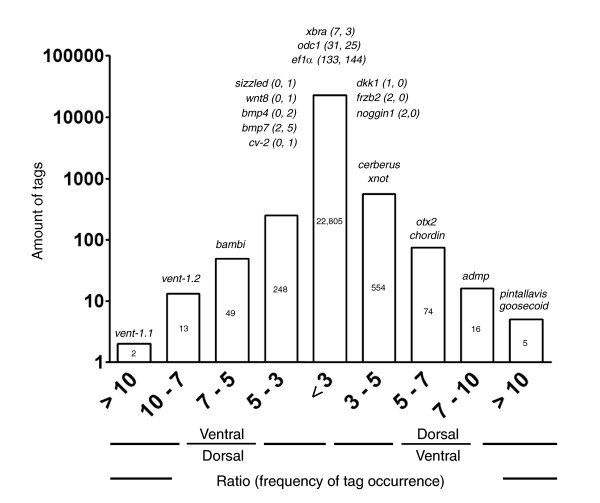
Figure 2.
Comparison of the normalized frequencies of tag occurrence between dorsal and ventral SAGE libraries. Tag frequencies were normalized with respect to the total tags in each library (31,175 total dorsal tags and 32,047 total ventral tags), grouped according to their ratio of frequency of occurrence in both libraries and plotted against the counts of tags in each category. The number of tags is indicated inside each bar. Expected tags for known genes with a role in dorso-ventral patterning and control genes are indicated for each category. For these genes, the frequency of occurrence in each library is indicated in parentheses (tag frequency in dorsal library; tag frequency in ventral library).

