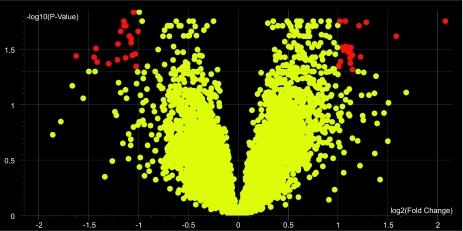
Figure 1.
A volcano plot was used to visualize and identify genes, shown in red, whose expression ratio between anergic and naïve B cells differed between MRL and B6 strains. Cutoff criteria for differential expression in this analysis is defined as a minimum fold change of 2.0, plotted on the X axis, with a multiple testing corrected p-value (plotted on the Y axis) of less than 0.05.

