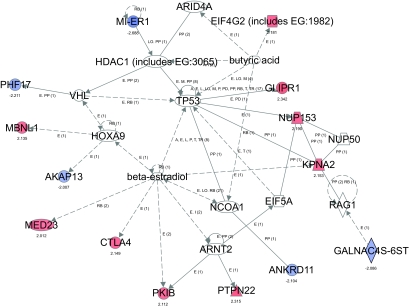
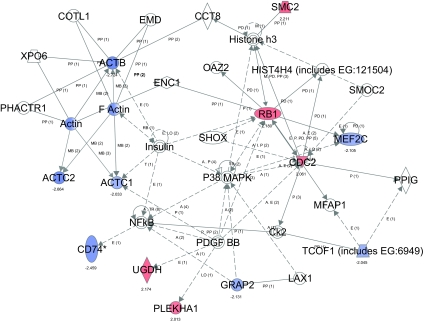
Figure 3.
Network analysis of genes differentially expressed in B6 versus MRL anergic B cells. Ingenuity software generated two major networks (labeled 1 and 2) interconnecting multiple array-identified genes (shown in solid blue for expression lower in B6 than MRL and in red for higher expression in B6). The numbers displayed below array-identified genes indicate relative fold-change in B6 anergic cells. The networks summarize interactions between functional pathways and the genes that are altered in expression.


