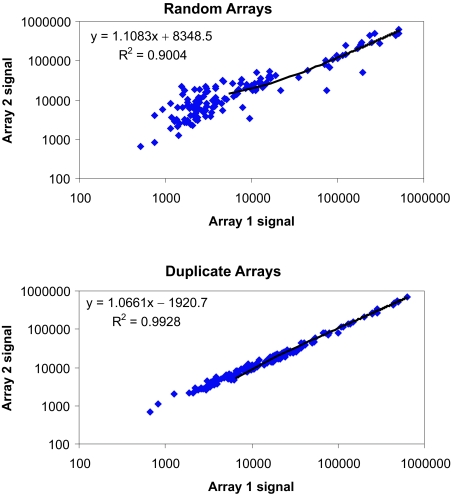
Figure 1. Duplicate arrays show greater correlation coefficients than a random pair of arrays.
Background-subtracted log-10-transformed fluorescence signals for each protein are shown with one sample shown on each axis. The tight distribution of data in the duplicate arrays indicates the platform reproducibility.

